
Why two Vaporizers produce different amounts at the same temperature
Set two Vaporizers to the same temperature and give both the same material—and they will still produce different amounts. This has been measured in the laboratory, with a difference of 28 percentage points between the best and weakest device. This article explains where this difference comes from in terms of design and what makes it larger or smaller during use.
Contents
1 · Yield is a Vaporizer’s efficiency
Every machine that transforms something has an efficiency. For a heat pump, it is the ratio of electricity consumed to heat generated; for an espresso machine, it is the proportion of soluble components that actually ends up in the cup. For a Vaporizer, it is the yield: the proportion of the active ingredient present in the material that the device transfers into the gas phase. An 80 percent yield means that four-fifths make their way into the vapor, while one-fifth remains in the plant material.
It is important to understand what this does not mean. Yield is a laboratory value and describes the performance of the device alone. It is measured as follows: under controlled conditions, the device fills a balloon, whose contents are then chemically analyzed. What is lost again when exhaling or not absorbed by the lungs depends on the person, not the device—and is therefore not the subject of this article.
That is precisely why it is so useful: it is the only metric in which different Vaporizers were measured directly against one another under identical conditions. No data sheet provides anything comparable.
2 · The measurements: five devices compared
The most informative study on this topic was conducted by Lanz and colleagues and published in 2016 in PLoS ONE, a freely accessible academic journal.[1] Five commercially available devices were tested. All received the same material and—where adjustable—the same temperature of 210 °C. The researchers then measured how much THC and CBD actually reached the vapor.
Table 1 · Active-ingredient yield in the vapor, measured at a uniform 210 °C. All values after Lanz et al. 2016.[1] See the note below the table regarding anonymization.
| Device | Heating principle | THC | CBD | Note |
|---|---|---|---|---|
| Device A | predominantly convection | 82,7 % | 70,0 % | Best result in the test field—and also the cheapest, most compact device |
| Device B | Hybrid, stationary | 66,8 % | 56,1 % | Second-best result |
| Device C | Convection, stationary | 58,4 % | 51,4 % | Significantly more expensive than Device A, but finished in the middle of the field |
| Device D | gas-powered | 55,9 % | 45,9 % | No temperature control; combustion was observed during the test |
| Device E | Conduction, portable | 54,6 % | 56,7 % | Weakest THC result, but mid-range for CBD |
Two points deserve a closer look. First, the best device was not the most expensive but a compact portable one. Price therefore says little about yield. Second, the best and weakest results differ by 28 percentage points—with identical material and identical temperature. The difference is due solely to the design.
3 · The share that never leaves the chamber
Every yield figure has a downside: What does not reach the vapor remains in the material. At a yield of 82.7 percent, that is 17.3 percent; at 54.6 percent, it is still 45.4 percent. Almost half.
Figure 1 · What reaches the vapor from a filling
Best and weakest device in the comparison, based on the THC content. After Lanz et al. 2016.[1]
4 · What the difference means in practice
The yield values directly show how much material two devices need for the same result. The calculation is a simple division: 82.7 divided by 54.6 gives 1,51. The weakest device therefore has to use one and a half times as much to deliver the same amount of active compound in the vapor.
Figure 2 · Material use for the same result
Relative representation, calculated from the yield values of 82.7% and 54.6%.[1]
For the entire test field, this relationship looks like this. The right-hand column shows how much material a device must use relative to the best value to achieve the same result.
Table 2 · What the yield values mean in relative terms. All figures are calculated from Table 1.
| Device | Yield | remains in the material | Material use relative to |
|---|---|---|---|
| Device A | 82,7 % | 17,3 % | 100 % |
| Device B | 66,8 % | 33,2 % | 124 % |
| Device C | 58,4 % | 41,6 % | 142 % |
| Device D | 55,9 % | 44,1 % | 148 % |
| Device E | 54,6 % | 45,4 % | 151 % |
The gap between the average devices is small, while the gap at the top is large. Devices B and E differ by only 27 percentage points in material use, whereas device A differs from the rest of the field by at least 24. In other words, there is no gradual decline, but rather an outlier at the top.
5 · Why almost nothing is lost: decarboxylation
In the fresh plant, the active compound is not present in its active form at all, but as an acid—THCA rather than THC. This acid form is practically inactive. Heat first removes a carbon dioxide molecule, turning it into the active compound. This process is called decarboxylation.
How quickly and completely this happens depends on temperature and time. A working group systematically measured this relationship in 2016.[4] More important in practice, however, is what actually reaches the device: In a comparative test that same year, the electrically heated, temperature-controlled devices achieved conversion rates of at least 97 percent.[1]
That is good news and is rarely mentioned: Almost nothing is lost at this stage. Anyone who “activates” their material in the oven beforehand does so for other applications—it is not necessary for the Vaporizer, because the device takes care of it during heating anyway.
6 · What Changes Yield During Use
Temperature is the biggest lever. In both directions. Lower is not automatically better: In a 2009 study, the ratio of active compound to unwanted by-products was least favorable at 170 °C among all the vapor conditions tested—it was more favorable at 200 and 230 °C.[3] The combustion threshold sets the upper limit. The temperature article in this series explains in detail which temperature makes sense for what.
Grind size determines the surface area. The finer the material, the more surface area the heat can reach. With convection devices, where hot air flows through the material, even grinding is therefore noticeably more important than with devices that have a heated chamber wall. However, too fine is not good either, as it can block the airflow.
The amount of material can work in both directions. A 2006 device study already examined different amounts of material—the fill level has therefore long been known as an influencing factor.[5] In practice, the rule is simple: A chamber filled too loosely lets air flow past the sides, while one packed too tightly restricts it. With convection and hybrid devices, a loose to medium fill usually works best.
Draw speed matters above all with convection. That is where heat is generated in the airflow—if you draw quickly, you send air through the material that has had less time to heat up. Slow, steady draws therefore generally deliver more. Which principle your device uses is explained in the article on heating principles.
Table 3 · The adjustment factors at a glance, sorted by impact.
| Adjustment | What it does | Supported by | Effort |
|---|---|---|---|
| Temperature | Determines how much active compound is released and how cleanly it compares with by-products | Measurement series at 170 / 200 / 230 °C[3] | none |
| Choice of device | 28 percentage points difference at the same setting | Device comparison at 210 °C[1] | one-time purchase |
| Grind size | More surface area for heat transfer | based on physical principles, not measured for a specific device | a grinder |
| Amount of material | Controls how evenly the air flows through the material | examined as an influencing factor[5] | none |
| Draw speed | Determines how hot the air reaches the material in convection devices | based on physical principles, not measured for a specific device | none |
7 · Where the Numbers End
Three limitations should be kept in mind with this article so that the figures are interpreted correctly.
First, the measurements were taken in a laboratory, not in a living room. Under controlled conditions, the devices filled a balloon. In everyday use, grind size, filling quantity, inhalation technique, and material moisture also play a role—all factors that can shift the result in either direction.
Second, the study dates from 2016, and the successor models of the tested devices were not measured. The ranking from that time cannot be transferred uncritically to today’s devices.
Third, yield is not the only reason to use a Vaporizer, and probably not even the most important one. The first comparative laboratory analysis, conducted in 2004, found only three accompanying compounds in the vapor besides the active ingredients—there were more than 111 in the smoke from the same sample.[2] Anyone interested in the composition of the vapor can find a detailed discussion in the related article.
What remains is still an unusually clear finding: Two devices with identical settings differed by 28 percentage points. For hardly any other property of a Vaporizer is the difference measured so clearly—and so little a matter of taste.
8 · Frequently asked questions
Why do devices differ at all when the temperature is the same?
Because the set temperature is only a target value. What matters is how much heat actually reaches the material, how evenly it is distributed, and how the airflow is directed through the chamber. That is exactly what distinguishes two designs, even when the same number appears on both displays.
How large is the difference between two devices?
In the 2016 laboratory test, the difference in yield between the best and weakest results was 28 percentage points.[1] In other words, the least efficient device had to use around half again as much material to achieve the same result. However, the figures come from devices from 2016 and do not apply to today’s models.
Is an expensive device automatically more efficient?
No. In the 2016 laboratory test, the cheapest, most compact device came out on top, while a considerably more expensive desktop device ranked in the middle.[1] The design is what matters, not the price.
Can I check my device’s yield myself?
Not meaningfully. The published figures come from chromatographic laboratory analyses in which the chamber contents were quantified before and after operation. This cannot be replicated at home—visible discoloration or odor provides no reliable information about the actual residual content.
Do I need to activate my material beforehand?
Not for the Vaporizer. The conversion of the acid form into the active form occurs when heating in the device; rates of at least 97 percent were measured in temperature-controlled devices.[1]
Does a low temperature produce a higher yield?
No, quite the opposite. In the 2009 series of measurements, the ratio of active compound to by-products was least favorable at 170 °C; it was better at 200 and 230 °C.[3] Very low temperatures deliver lots of flavor but little active compound.
Devices where yield is the priority
The article above deliberately mentions neither products nor device names from the study. What it does mention are the features that, according to the measurement data, matter most: a temperature that can be finely adjusted and then maintained, and an airflow path that passes evenly through the material. These are devices from our product range in which precisely these aspects have been addressed by design. We explicitly do not provide yield figures from the study for them—different devices were measured at a different time.
Precisely adjustable by degree
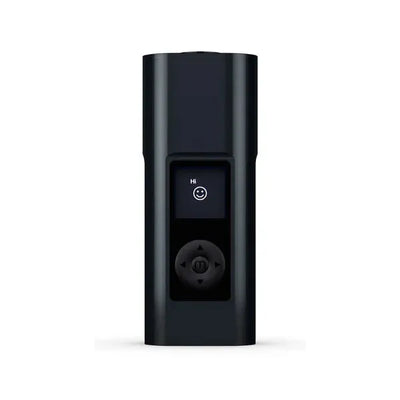
Arizer Solo 3 Version 2.0
Predominantly convection-based, with a vapor path made entirely of glass and a temperature adjustable from 40 to 220 °C in one-degree increments. This allows the temperature to be controlled as precisely as Section 6 suggests.
View Solo 3 →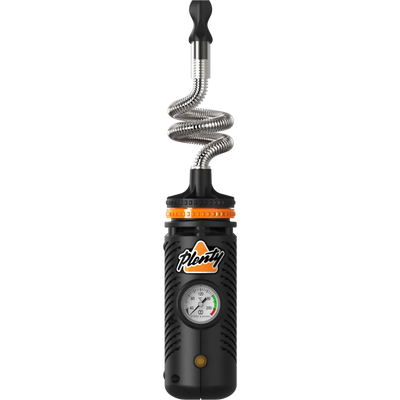
Storz & Bickel Plenty
A stationary hybrid combining a preheated chamber and airflow, with a stainless steel cooling coil instead of plastic in the vapor path. Seven temperature levels between 130 and 202 °C cover the range discussed in Section 6.
View Plenty →With levels, airflow control, or app
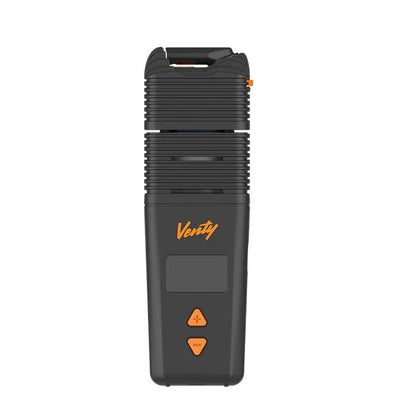
Storz & Bickel Venty
Precisely adjustable from 40 to 210 °C, plus continuously adjustable airflow of up to 20 liters per minute. Together, these address exactly the two control variables from Section 6 that make the biggest difference in everyday use: temperature and draw speed.
View Venty →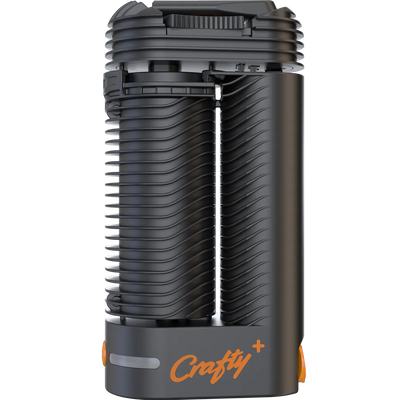
Storz & Bickel Crafty+
The more affordable entry into the same technology: hybrid heating with a ceramic-coated chamber, three button settings for 180, 195, and 210 °C, plus finer adjustment via app. The three levels practically reproduce the stepped approach from Section 6 by themselves.
View Crafty+ →Sources
- Lanz C., Mattsson J., Soydaner U., Brenneisen R. (2016): Medicinal Cannabis: In Vitro Validation of Vaporizers for the Smoke-Free Inhalation of Cannabis. PLoS ONE 11(1): e0147286. DOI: 10.1371/journal.pone.0147286 – Primary source for all yield values (54.6–82.7%) and decarboxylation rates. Freely accessible.
- Gieringer D., St. Laurent J., Goodrich S. (2004): Cannabis Vaporizer Combines Efficient Delivery of THC with Effective Suppression of Pyrolytic Compounds. Journal of Cannabis Therapeutics 4(1): 7–27. DOI: 10.1300/J175v04n01_02 – Primary source for the comparison of more than 111 compounds in smoke versus three in vapor.
- Pomahacova B., Van der Kooy F., Verpoorte R. (2009): Cannabis smoke condensate III: the cannabinoid content of vaporised Cannabis sativa. Inhalation Toxicology 21(13): 1108–1112. DOI: 10.3109/08958370902748559 – Primary source for the temperature series at 170 / 200 / 230 °C.
- Wang M., Wang Y.-H., Avula B., Radwan M. M., Wanas A. S., van Antwerp J., Parcher J. F., ElSohly M. A., Khan I. A. (2016): Decarboxylation Study of Acidic Cannabinoids: A Novel Approach Using Ultra-High-Performance Supercritical Fluid Chromatography/Photodiode Array-Mass Spectrometry. Cannabis and Cannabinoid Research 1(1): 262–271. DOI: 10.1089/can.2016.0020 – Primary source for the kinetics of decarboxylation.
- Hazekamp A., Ruhaak R., Zuurman L., van Gerven J., Verpoorte R. (2006): Evaluation of a vaporizing device (Volcano) for the pulmonary administration of tetrahydrocannabinol. Journal of Pharmaceutical Sciences 95(6): 1308–1317. DOI: 10.1002/jps.20574 – Among other things, investigated the influence of different filling amounts.
Note: This article provides technical and scientific information about how vaporizers work and makes no statement about consuming specific substances. The use of vaporizers and handling of the substances mentioned are subject to the applicable laws and regulations. All yield and temperature values are taken from the cited literature and were determined under laboratory conditions; they are reference values and do not guarantee any particular device’s performance. The ratios in Section 4 are mathematically derived from these laboratory values and indicate an order of magnitude, not savings guaranteed in everyday use.


